Rochester's New Traffic Safety Dashboard Puts Every Crash on the Map
The Short Version
- Rochester averaged 9.6 traffic fatalities per 100,000 residents annually from 2020 to 2024 — the worst rate among comparable New York cities, exceeding Buffalo, Syracuse, Albany, and Yonkers.
- The city's new traffic safety dashboard maps every crash since 2023, filterable by location, year, severity, and whether pedestrians or cyclists were involved — live now at cityofrochester.gov.
- About 13 pedestrians and cyclists are killed on Rochester streets every year; two died on Lake Avenue in October 2026 alone, on October 5 and October 13.
- Rochester adopted Vision Zero in June 2024 and has since built 19 of a planned 63-mile bike network and implemented a citywide 25 mph speed limit.
- A July 2026 survey found 57% of respondents oppose automated enforcement broadly, but support jumps to 61% for school-zone speed cameras and 77% for school bus stop-arm cameras.
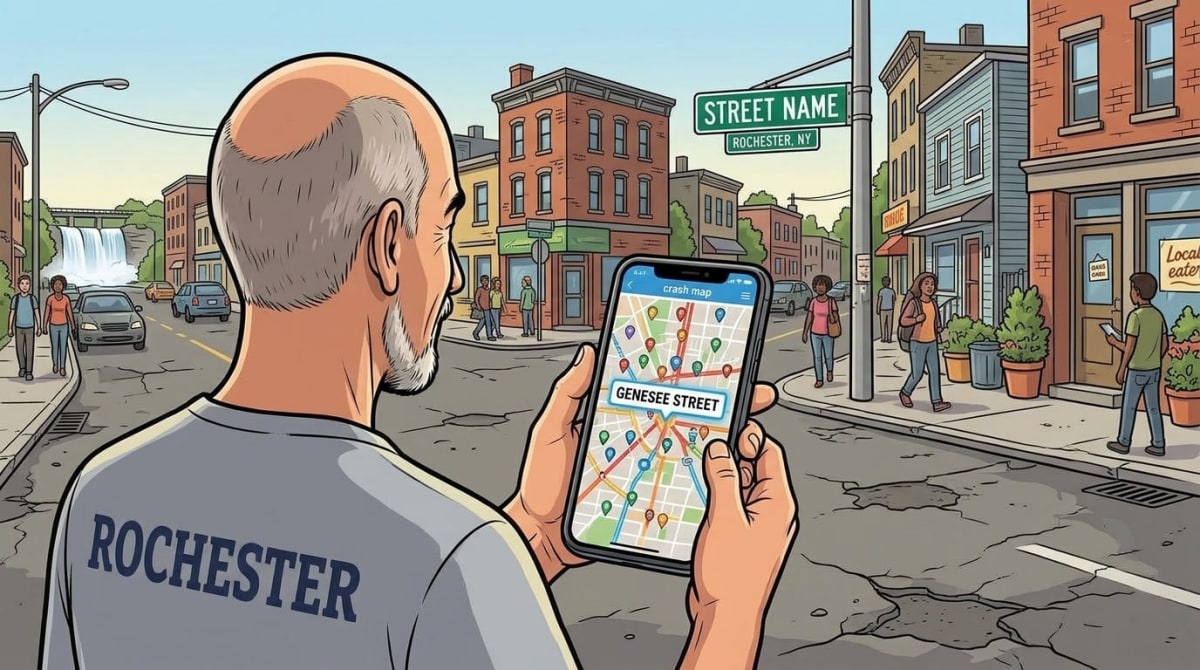
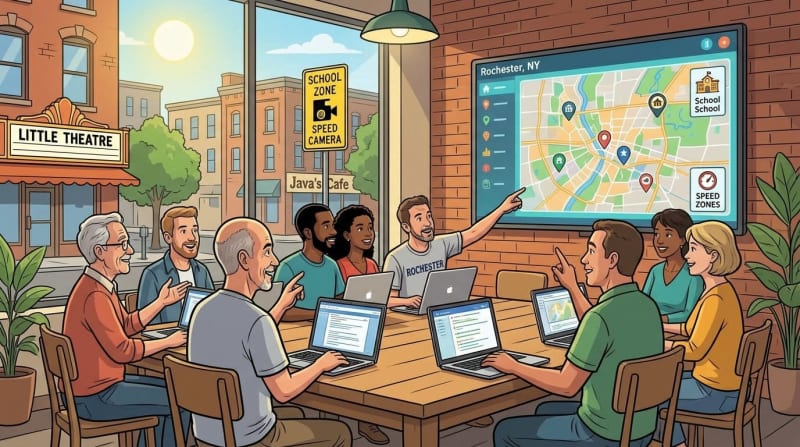
Rochester's new traffic safety dashboard launched this month with something the city has not offered before: a clickable map of every recorded crash, filterable by year, severity, and whether a pedestrian or cyclist was involved. The data runs from 2023 to the current month. If you live on a stretch of road that feels dangerous, you can now look it up by name.
What the Rochester Traffic Safety Dashboard Shows
What the Rochester Traffic Safety Dashboard Shows
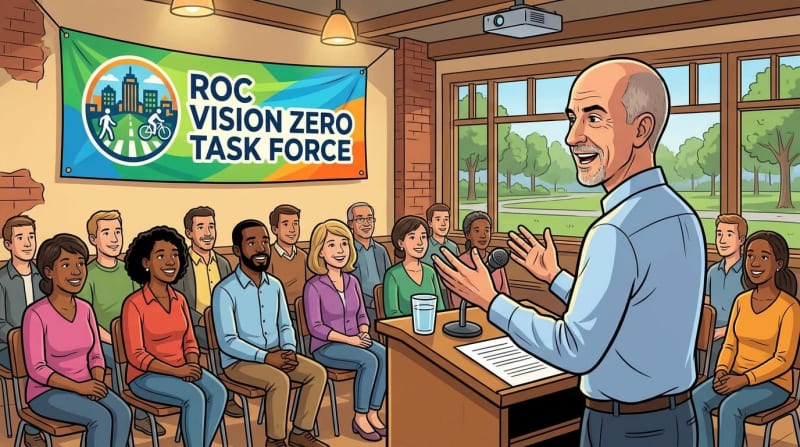
The Rochester traffic safety dashboard, available through the city's ROC Vision Zero page, covers motor vehicle crashes, fatalities, and collisions specifically involving pedestrians and cyclists. Residents can filter by location, year, and crash type — or click directly on the map to pull up what happened at a specific intersection.
Chris Wagner, co-chair of the ROC Vision Zero Task Force, described the purpose plainly: "This dashboard gives residents another way to understand what we are seeing and, importantly, what we are doing about it."
The city also released a community input report on automated traffic enforcement alongside the dashboard. Together, the two documents create something close to an accountability loop: one shows where crashes are concentrated, the other records what residents told the city about the tools available to address them.
Rochester's Streets Are Among New York's Most Dangerous
Rochester's Streets Are Among New York's Most Dangerous
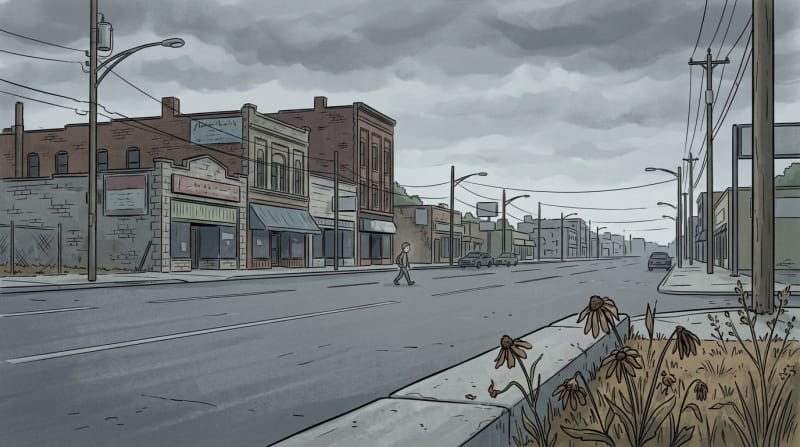
The backdrop matters. According to Streetsblog Empire State, Rochester averaged 9.6 traffic fatalities per 100,000 residents annually from 2020 to 2024 — worse than Buffalo (6.6), Syracuse (6.7), Albany (6.2), and Yonkers (3.3), per state DOT data. Mayor Malik Evans has described Rochester as having "the dubious distinction of being one of the cities with the worst crash rates in all of New York State."
That rate translates to about 13 pedestrians and cyclists killed on city streets every year. October 2026 has already claimed two of them: both on Lake Avenue, one on October 5 and one on October 13.
Nearly one in four Rochester households has no car. A large share of residents cannot avoid these conditions — they walk, bike, or take the bus because there is no alternative.
What ROC Vision Zero Has Done Since 2024

What ROC Vision Zero Has Done Since 2024
Rochester adopted Vision Zero on June 6, 2024, committing to eliminate all traffic fatalities and severe injuries through a 10-point plan. Mayor Evans made a specific promise at the time: "We are adopting a data-driven approach that will enable us to identify high-risk areas, implement targeted interventions and measure our progress."
Since then, the city has implemented a 25 mph speed limit citywide and built 19 miles of a planned 63-mile connected bicycle network, according to the city's Vision Zero page. The public dashboard is the transparency half of that promise — the place where residents can watch whether the infrastructure changes are moving the numbers.
Automated Enforcement: What Rochester Residents Said
Automated Enforcement: What Rochester Residents Said
The community input report covers speed cameras and red-light cameras. A July 2026 survey of 200 roundtable participants and 1,370 online respondents found that 57% oppose automated enforcement in principle. The picture shifts when the question narrows: 61% support school-zone speed cameras, and 77% support school bus stop-arm cameras.
The city says the survey results will shape future enforcement decisions. The dashboard is now where residents can hold that promise to account — checking whether fatalities and pedestrian collisions decline, block by block, year over year.
The Rochester traffic safety dashboard is live at cityofrochester.gov.
Content ID: dnpMGgpTDPACIADKLM6mBktc
See an error? Tell us.

Comments
Share with the Community